Segmenting Clients with Clustering
Finding Natural Groups in Transaction Data
All the attention right now is on large language models. But there's a whole category of machine learning that's been quietly useful for years and doesn't require a GPU or a billion parameters. Clustering is one of those techniques. The idea is simple. Given a pile of client data, can an algorithm find natural groups without being told what to look for? I wanted to try it.
Building Features
I'm working with the same Berka dataset from earlier posts. Over a million transactions across 4,500 accounts. But raw transactions aren't useful for clustering. We need to summarize each account into a set of features that describe its behavior.
import pandas as pd
from sklearn.preprocessing import StandardScaler
from sklearn.cluster import KMeans

df = pd.read_csv('transaction.csv')

account_features = df.groupby('account_id').agg(
    total_transactions=('trans_id', 'count'),
    avg_balance=('balance', 'mean'),
    avg_transaction_amount=('amount', 'mean'),
    total_credits=('type', lambda x: (x == 'credit').sum()),
    total_debits=('type', lambda x: (x == 'debit').sum()),
).reset_index()

balance_std = df.groupby('account_id')['balance'].std().reset_index()
balance_std.columns = ['account_id', 'balance_volatility']
account_features = account_features.merge(balance_std, on='account_id')
account_features['credit_ratio'] = (
    account_features['total_credits'] / account_features['total_transactions']
)
Each account now has five features. How many transactions it has, its average balance, average transaction size, how much the balance swings around, and the ratio of credits to total transactions. That last one is interesting because it captures whether an account is primarily receiving money or spending it.
The scaling step matters. K-means uses distance between data points, so a feature like average balance (ranging into the thousands) would completely overwhelm credit ratio (between 0 and 1) if we don't normalize everything first.
feature_cols = ['total_transactions', 'avg_balance',
                'avg_transaction_amount', 'balance_volatility',
                'credit_ratio']

scaler = StandardScaler()
X_scaled = scaler.fit_transform(account_features[feature_cols])
Choosing K
K-means needs to know how many clusters to find. The standard approach is the elbow method. Run the algorithm for a range of K values and plot the inertia, which measures how tight the clusters are internally. Where the curve bends is usually the right K.
inertias = []
for k in range(2, 11):
    km = KMeans(n_clusters=k, random_state=42, n_init=10)
    km.fit(X_scaled)
    inertias.append(km.inertia_)
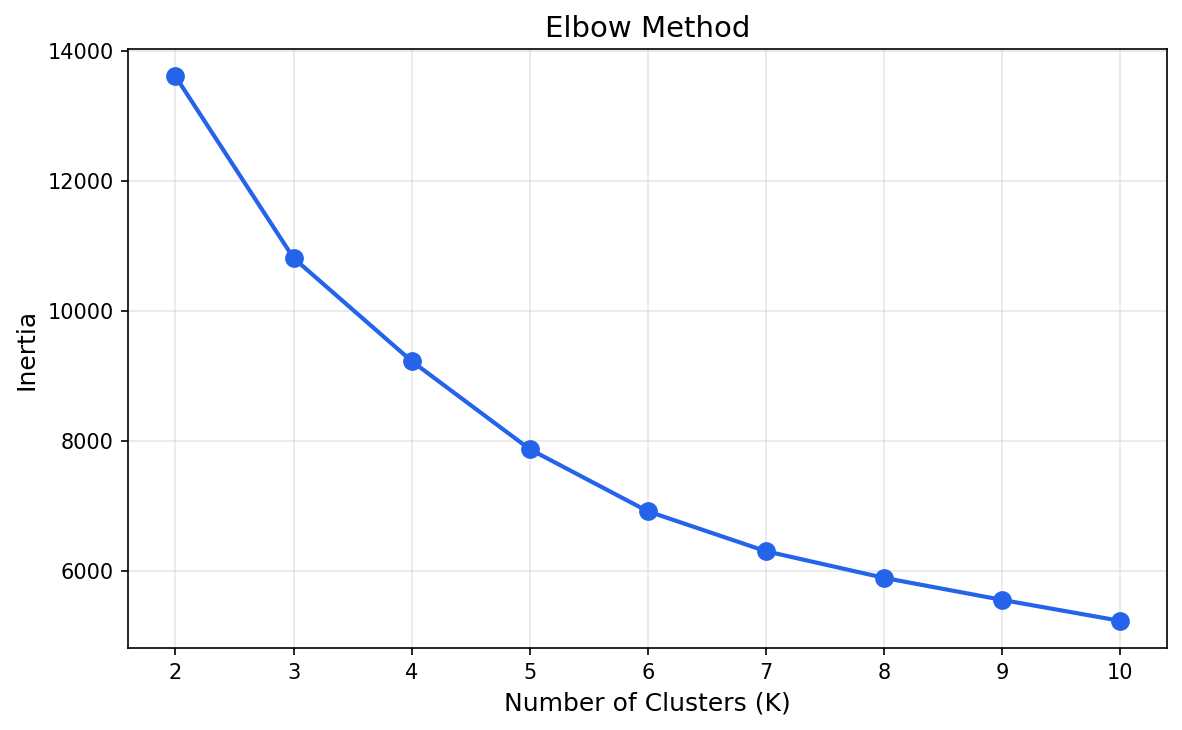
The bend happens around K=4. After that, adding more clusters doesn't improve the grouping much. Four segments feels right for a dataset this size, so let's go with that.
The Segments
km = KMeans(n_clusters=4, random_state=42, n_init=10)
account_features['cluster'] = km.fit_predict(X_scaled)
account_features.groupby('cluster')[feature_cols].mean().round(2)
         total_transactions  avg_balance  avg_transaction_amount  balance_volatility  credit_ratio
cluster
0                    125         1046.03                  139.43              369.58          0.52
1                    305         1413.12                  206.77              437.84          0.34
2                    265         1832.92                  396.20              844.40          0.41
3                    211          751.42                   81.56              201.19          0.40
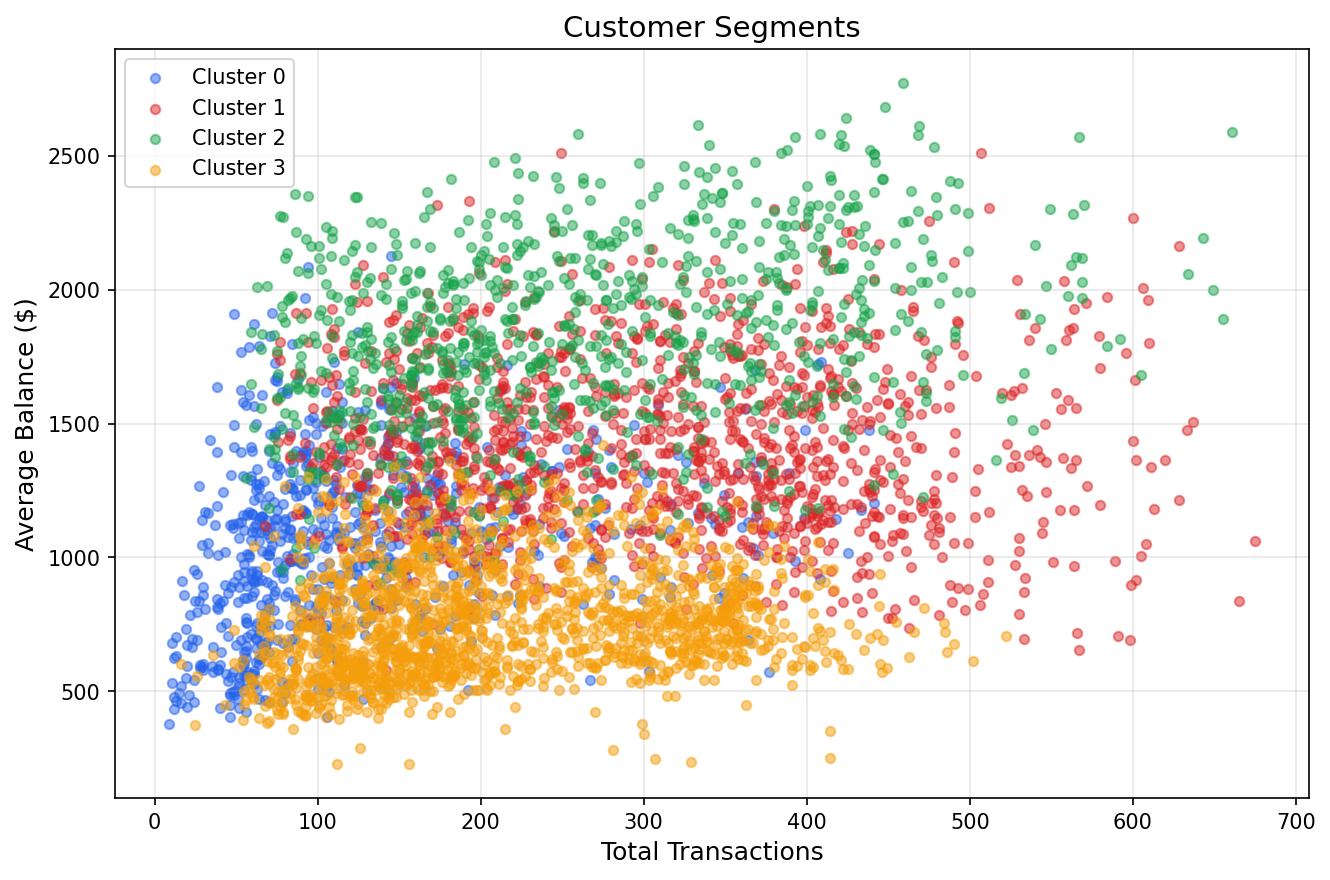
Four distinct patterns. Cluster 3 is the largest group at 1,594 accounts. Modest balances, small steady transactions, low volatility. These are the everyday checking accounts that make up the core of any community bank.
Cluster 1 has the most activity at 305 transactions per account and the lowest credit ratio at 34%. Money goes out more than it comes in. These are high-activity, spending-heavy clients.
Cluster 0 is the quietest with only 125 transactions on average, but the highest credit ratio at 52%. More money coming in than going out, with moderate balances. Savings-oriented behavior.
Cluster 2 stands out. Highest average balance at $1,833, the largest transaction amounts at $396, and by far the most volatility. These are the high-value clients moving significant amounts of money through their accounts.
Making It Useful
None of this required a neural network or a GPU. K-means has been around since the 1950s. But the output is genuinely useful. If a bank wanted to design targeted products, these four segments suggest very different needs. The high-activity spenders might respond to rewards programs. The high-balance clients might be candidates for premium services or wealth management. The quiet savers could benefit from better deposit rates.
What surprised me is how cleanly the segments fell out. I didn't tell the algorithm anything about banking or client types. It just found the structure that was already sitting in the transaction data, waiting to be seen. The real work isn't in the clustering algorithm itself. It's in choosing the right features and asking the right questions about what comes out.